

A periodic table of metropolitan areas in the United States
Because I had some spare time over the last week apparently.
I don’t have a long story today, but I did want to share something I created over the last week. Sometimes I get weird sources of inspiration and decide I need to make my own variation of it. In this case, I saw a periodic table of mountain peaks and decided I needed to create one based on geography. I found the distinct layout of information and visualization enticing and, if nothing else, simply a refreshing way to look at and categorize geographic space.
A periodic table, as you probably know, is typically organized based on the elements (helium, hydrogen, gold, etc.). The visualization concept allows for a quick, easy and digestible way to take in a lot of information without getting too bogged down in the details. And while it certainly works with the elements, there’s nothing to say it can’t also work with basically anything else!
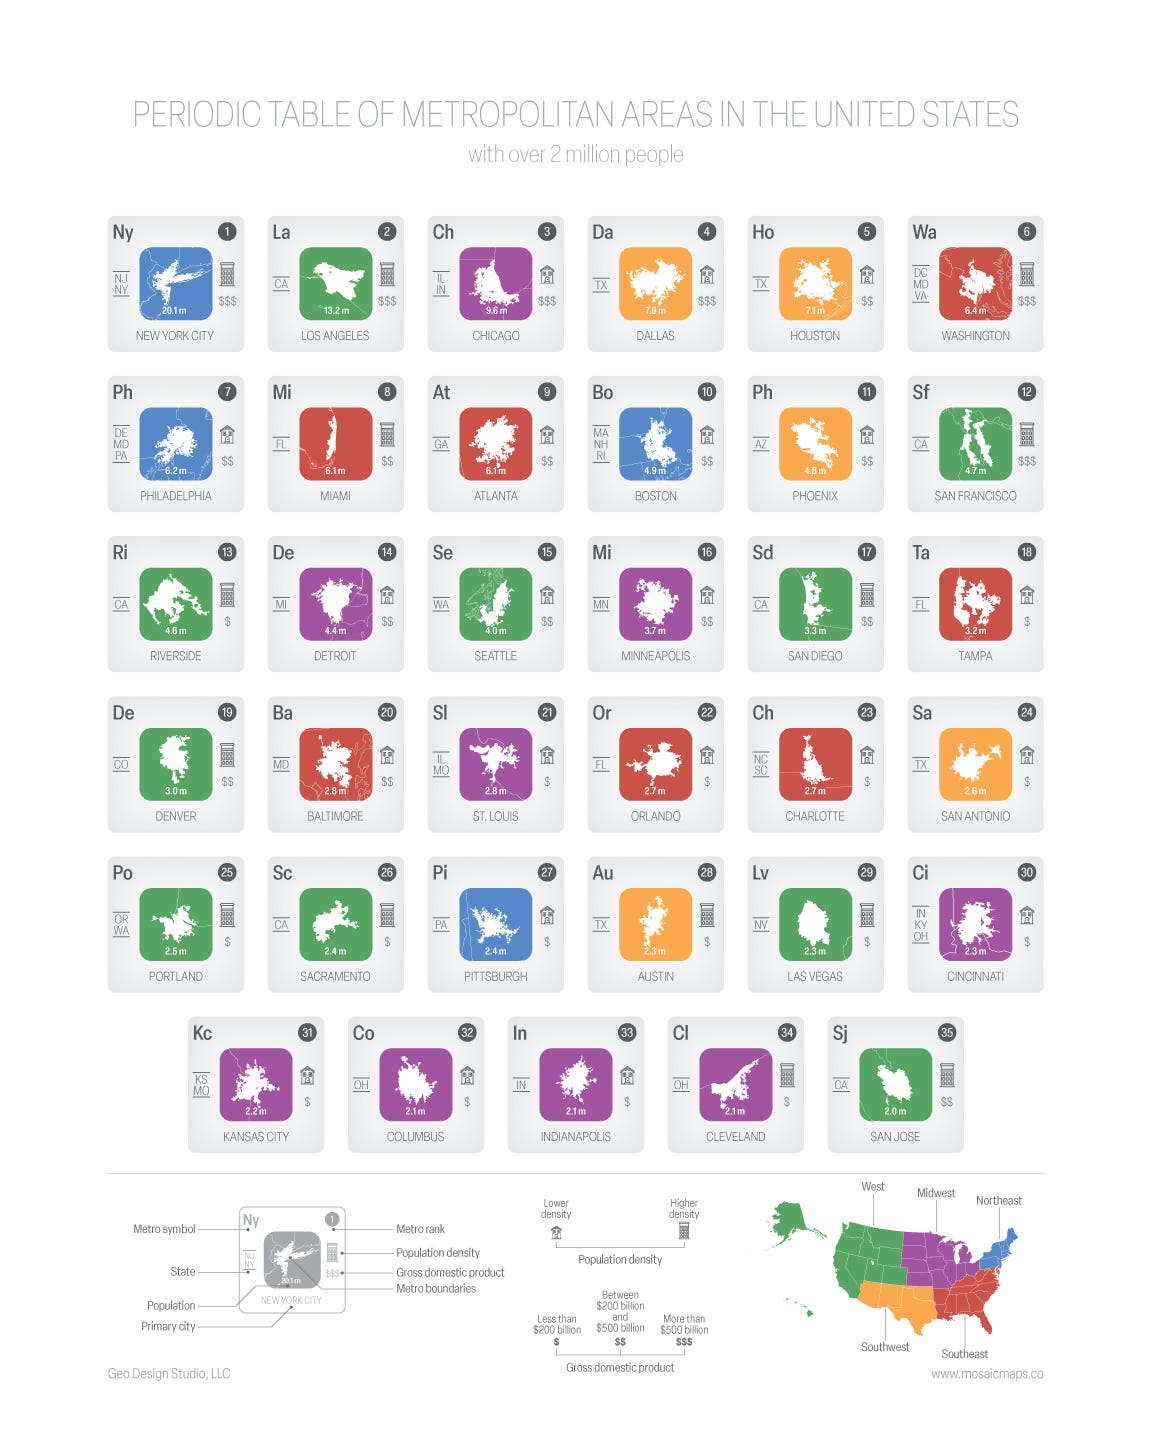
As such, I present my own spin on the formula: a periodic table of metropolitan areas of the United States with a population of 2 million or more.
Now you may have a few questions so I’ll try to answer them here:
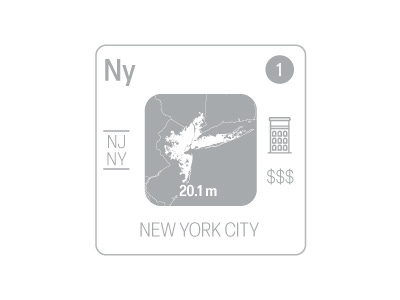
Why metropolitan areas rather than cities? I find metro areas are generally more important and interesting than just cities by themselves. No single city is truly independent.
Why is Chicago shown as low density and Riverside shown as high density? That seems backwards. Ya it seems weird right? But it’s simply because metro areas vary greatly in their size and some can include incredibly low-dense areas. All metro area boundaries and populations come from the U.S. Census Bureau so you’ll have to take it up with them if you have any issues.
Such and such state is absolutely not apart of that region! Maybe, maybe not. I derived the regions from the National Geographic Society. I generally try not to come up with my own boundaries if I can help it.
I would love to see one of these for this region or this concept! I plan on making others for cities in Europe and Asia as well as states and countries. But I only have so much time, so they’ll likely be slow coming. I post my one-off art projects here so if you’re subscribed you’ll definitely know when a new one is out.
I hope you enjoy it! I have a lot of these kinds of map designs and data visualizations that I’ll plan on sharing over the coming months. So stay tuned for that.
I'd take this as a duvet cover.